Data and AI Intensive Research with Rigor and Reproducibility
MIDAS leads the Data and AI Intensive Research with Rigor and Reproducibility (DAIR3) program, which includes weeklong bootcamps in the summer that focus on ethical issues in biomedical data science; data management, representation, and sharing; rigorous analytical design; the design and reporting of AI models; generative AI; reproducible workflow; and assessing findings across studies. Additionally, the bootcamp also includes grant writing sessions and research collaboration discussions.
Learn More
2026 APPLICATIONS CLOSED
Please check back in the fall for next year’s application.
The rigor of scientific research and the reproducibility of research results are essential for the validity of research findings and the trustworthiness of science. However, research rigor and reproducibility remains a significant challenge across scientific fields, especially for research with complex data types from heterogeneous sources, and long data manipulation pipelines. This is especially critical as data science and artificial intelligence (AI) methods emerge at lightning speed and researchers scramble to seize the opportunities that the new methods bring.
While researchers recognize the importance of rigor and reproducibility, they often lack the resources and the technical know-how to achieve this consistently in practice. With funding from the National Institutes of Health, a multi-university team offers a nationwide program to equip faculty and technical staff in biomedical sciences with the skills needed to improve the rigor and reproducibility of their research, and help them transfer such skills to their trainees.
Trainees will then be guided over a one-year period to incorporate the newly acquired mindset, skills and tools into their research; and develop training for their own institutions.
The DAIR3 team and instructors include faculty and staff research leaders from the University of Michigan, the College of William and Mary, Jackson State University, and University of Texas San Antonio.
The third round of bootcamps will be offered in Summer 2026.
Program Team

Clifton Addison
Jackson State University

Yalanda Barner
Jackson State University

Johann Gagnon-Bartsch
University of Michigan


Gregory Hunt
College of William and Mary

H. V. Jagadish
MIDAS Director (on leave), University of Michigan

Brenda Jenkins
Jackson State University

Erin Kaleba
University of Michigan

Jing Liu
Principal Investigator
MIDAS Executive Director, University of Michigan

Jodyn Platt
University of Michigan Medical School

Kelly Psilidis
Faculty Training Program Manager University of Michigan

Suraj Rampure
University of Michigan

Michele Randolph
University of Michigan

Kerby Shedden
University of Michigan
Curriculum
Below is the 2026 curriculum.
1.1 RCR in the Context of Biomedical Data Science
This lesson examines the sociotechnical and ethical aspects of biomedical data science. We will consider ethical issues in the responsible conduct of research that are novel to or pose new challenges in the context of biomedical data science such as reproducibility and privacy. Students will also consider biomedical data science as a sociotechnical system and define roles for themselves and other key constituents.
Learning Objectives:
- Explain novel ethical issues in responsible conduct of research for data science such as reproducibility and privacy.
- Describe the landscape of biomedical data science as a sociotechnical system and articulate roles.
1.2 What are Ethics? Ethical Issues in Biomedical Data Science
This lesson equips students to address ethical challenges in biomedical data science. Learners will identify strategies for ethical secondary data use, analyze engagement approaches, and develop frameworks for ethical project review, emphasizing anticipatory governance and responsible data science practices. Case studies will be used that draw on the group project selected for the 2026 cohort.
Learning Objectives:
- Differentiate between traditional bioethical, sociotechnical, and other ethical approaches to data science research and applications.
- Evaluate key ethical challenges in biomedical data science.
- Identify and formulate approaches to address ethical issues in secondary use, including anticipatory governance principles.
- Develop a framework for ethical review of biomedical data science projects.
2.1 Data Collection and Storage
This lesson enables learners to design robust, ethical research plans and identify the optimal data collection method for high-quality, reproducible findings.
Learning Objectives:
- Distinguish between qualitative and quantitative data.
- Apply methods for gathering, organizing, and cleaning data to ensure quality and integrity.
- Ensure ethical compliance of data collection, handling, and storage.
2.2 Metadata – Data About Data
This lesson explores the essentials of metadata in biomedical research datasets, covering data collection methods, population, and context. Students will learn to identify high-quality metadata that supports reproducibility and distinguish it from inadequate metadata, ensuring robust and reliable research outcomes.
Learning Objectives:
- Understand standard components of metadata on biomedical science research datasets: how the data were collected, on what population, under what circumstances, etc.
- Learn to distinguish between good and bad metadata for reproducibility.
2.3 Data Representation
This lesson examines how data can be represented in multiple ways, highlighting that each representation impacts task efficiency. Students will learn to select optimal data representations tailored to specific research tasks, balancing ease and complexity.
Learning Objectives:
- Understand that the same data can be represented in many ways.
- Appreciate that each representation choice makes some tasks easier, but others more difficult.
- Learn how to choose a good representation for the task at hand.
2.4.1 Data Sharing 101
This lesson introduces the principles of Open Science, focusing on the NIH Data Management & Sharing Policy’s rationale and key components. Students will explore the FAIR Guiding Principles (Findable, Accessible, Interoperable, Reusable), learning their definitions and practical examples to promote transparent and reproducible research.
Learning Objectives:
- Appreciate the foundations of Open Science
- NIH Data Management & Sharing Policy: Rationale and Key components
- FAIR Guiding Principles: Definition and examples
2.4.2 Data Sharing – The Reality
This lesson examines privacy and confidentiality concerns in Open Science and data sharing. Students will learn to differentiate between biomedical research types: bench science, human clinical trials, and animal models, and understand the unique data sharing implications for each, including ethical considerations and strategies to protect sensitive data while promoting transparency.
Learning Objectives:
- Learn about privacy/confidentiality concerns related to Open Science and data sharing.
- Articulate difference in types of biomedical research (bench science, human clinical trials, animal models) and what implications data sharing has for each.
This is a practical introduction to conducting rigorous data-driven research in a health-science setting. Our goal is that upon mastering this section, you will be able to use analytically sophisticated methods to obtain scientifically meaningful, reproducible, and innovative results in your research endeavors. We will focus here on methods for data analysis that can be utilized in the setting of population health research, leveraging official statistics or other systematically collected data with spatial and temporal structure.
This document focuses on design, strategy, and interpretation, and includes no code or numerical results. This Python notebook provides some model analyses from which you can borrow ideas as you start to implement analyses informed by the principles covered here.
3.1 Principles of study design for empirical research – Developing a study design for a research aim
In this subunit, we will consider how you can develop an understanding of the main ideas in a scientific domain in which you intend to conduct research, how to understand and communicate about the capacity of a given dataset for addressing research topics of interest, and how to develop a specific and tractable research aim.
Learning Objectives:
- You will be able to rapidly internalize the current state of scientific knowledge about a specific health-related topic. The goal here is not to master every detail that a domain specialist would know, but rather to develop fluency with the key known mechanisms, to recognize the quantitative strengths of established relationships, and to identify gaps in the current state of knowledge.
- You will be able to rapidly internalize the structure and capacity of a dataset that can be used to conduct research on a specific health-related topic. This includes identifying the units of analysis (who is being measured) and the variables or attributes (what is being measured), understanding how the units of analysis were selected, what population they represent, how the variables were measured, and what types of measurement errors may be present.
- You will be able to use appropriate terminology from epidemiology and biostatistics to discuss possible research studies relating to a given health-science domain, and that can be conducted using a provided dataset.
- You will be able to identify plausible exposures, outcomes, and control variables in a research design.
- You will be able to communicate in both speech and writing about a data-driven scientific inquiry in a health science setting. This will include strategies for effectively communicating to different audiences using precise but accessible language.
3.2 Developing an Analytic Plan
In this section, we will discuss how to develop a precise and actionable analytic plan.
Learning Objectives:
- You will be able to develop a rigorous analytic plan to address a stated scientific aim. The analytic plan should be able to be implemented using available data and should employ sophisticated and rigorous analytic methods.
- You will be able to explain the difference between conditional and marginal distributions, and identify which formal comparisons address a given research aim.
- You will be able to propose summary statistics that provide initial insight into research questions and that can capture the direction of a relationship, and the magnitude of the relationship in both relative and absolute terms.
- You will understand the different ways that an auxiliary variable can enter an analysis, such as being confounders and precision variables, and you will recognize when an auxiliary variable is unlikely to introduce confounding bias.
- You will be able to engage in a sophisticated discussion of quantitative relationships among measured quantities. This includes considering how such relationships can be assessed and how they contribute to achieving research aims.
3.3 Bias, Causal Interpretation, and Statistical Power
Students will learn to identify potential sources of bias, uncertainty, and non-reproducibility in observational cohort studies, and suggest basic strategies to address these issues.
Learning Objectives:
- You will be able to explain the concepts of effect size, parameter estimation, and estimation precision, which are the core theoretical ideas upon which a priori power analysis is based.
- You will be able to explain statistical uncertainty, including (a) a priori notions of uncertainty as reflected in statistical power, and (b) uncertainty following data analysis as reflected in statistical measures of confidence, significance, and precision. You will be able to identify specific features of the data and methods that result in lower confidence and higher bias.
- You will understand the conventional definition of power as the probability of research success contingent on the unknown true effect size. You will also be conversant in alternative notions of power that are directly related to estimation precision or prediction accuracy rather than hypothesis testing.
- You will be able to articulate how assessments of statistical power do and do not reflect the real-world reproducibility of analytic findings.
- You will understand how certain forms of bias can be reduced or eliminated analytically, while others cannot.
This unit introduces the foundations of supervised machine learning models, with a focus on interpretability and communicating modeling decisions. Throughout the unit, we will study the 2026 Data Challenge, in which students apply the same workflow to NCHS vital statistics data to project underweight births and infant mortality by Texas county.
4.1 Foundations of Predictive Modeling
This lesson introduces supervised learning through the workflow that students will use throughout the rest of the unit: selecting a prediction target, choosing features, fitting an interpretable baseline model, and evaluating it on held-out data. The emphasis is on understanding what the model is doing, not only on obtaining a good score.
Learning Objectives:
- Distinguish supervised learning from other common data analysis tasks, and distinguish regression from classification.
- Before fitting any model, articulate the prediction problem in research terms: name the outcome variable and how it is operationalized in the dataset, identify the unit of analysis, describe the population represented, and state the intended use of the forecast.
- Build a linear regression model as an interpretable baseline and explain what its coefficients represent.
- Practice the workflow for performing a train-test split, training a model on training data, evaluating it on held-out test data, and understanding how cross-validation works in practice.
- Identify common risks in predictive modeling, including overfitting and data leakage.
4.2 Interpretable Feature Engineering and Pipelines
This lesson focuses on interpretable feature engineering: creating features that better reflect patterns in the data while preserving interpretability. Students will use plots and domain knowledge to motivate simple transformations, encodings, and interactions, and will organize these steps within a small sklearn Pipeline.
Learning Objectives:
- Use visualizations to spot patterns in the data that may motivate feature engineering, such as nonlinearity, thresholds, and group differences.
- Understand when to use simple transformations, interaction terms, and common encoding strategies such as one-hot encoding.
- Build a small preprocessing and modeling Pipeline in sklearn and explain how the resulting features affect model interpretability.
4.3 Feature Justification, Multicollinearity, and Model Diagnostics
Building upon Section 4.2, students will learn how to decide whether a feature should remain in a model. The emphasis is on practical diagnostics and justification using correlations, multicollinearity checks, variance inflation factors, coefficient stability, and residual plots.
Learning Objectives:
- Use simple quantitative tools such as Pearson and Spearman correlation, multiple R², and variance inflation factor to identify useful, redundant, or unstable features and to recognize multicollinearity.
- Use residual plots and side-by-side model comparison to assess whether added complexity is justified.
- Explain why a feature was kept, transformed, or removed based on predictive performance, interpretability, and stability.
4.4 Model Reporting and Stakeholder Communication
This lesson focuses on communicating model performance and design decisions to external stakeholders. The goal is to turn the analytic work from Section 4.3 into a clear written summary that reports model results responsibly and in a form that aligns with the broader reporting expectations introduced earlier in the curriculum.
Learning Objectives:
- Understand how to report and compare interpretable predictive models using appropriate regression metrics such as MSE, RMSE, and MAE.
- Summarize model design choices, strengths, and limitations in language appropriate for a non-technical audience.
- Practice connecting model reporting to broader ideas of transparency and reproducibility, including the spirit of TRIPOD-style reporting.
5.1 Goals of Reproducible Analyses
Learn the key goals and challenges of creating reproducible, transparent, and user-friendly analyses that are easy to share and reuse.
Learning Objectives:
- Awareness of key challenges and goals when creating reproducible workflows, including making analyses reproducible, user friendly, transparent, reusable, version controlled, and archived.
5.2 Reproducibility via Code Notebooks
Gain awareness of Markdown, Jupyter, and Quarto, and learn how these tools integrate to create clear, reproducible workflows for data analysis and reporting.
Learning Objectives:
- Awareness of Markdown, Jupyter, Quarto, and how these tools can be integrated into reproducible workflows.
5.3 Best Practices for Reproducible Programming
Learn essential best practices for reproducible programming, including writing clear scripts and functions, avoiding magic numbers, using caching and seeding for randomness, and refactoring code to enhance clarity, reliability, and repeatability.
Learning Objectives:
- Awareness of best practices for reproducible programming including writing scripts, functions, avoiding magic numbers, caching and seeding randomness, and how to refactor code to align with these practices.
5.4 Version Control
Gain a basic understanding of Git, its advantages, and learn to perform essential tasks such as cloning repositories, committing changes, and syncing with remote repositories using push and pull commands.
Learning Objectives:
- Familiarity with Git and its benefits, and the ability to begin using it for simple tasks, including cloning, committing changes, pushing and pulling.
5.5 Containers
Gain hands-on experience with key dependency management tools (Python virtual environments, renv, and containerization), understanding their pros and cons, and develop the skills to create and run basic Docker images.
Learning Objectives:
- Familiarity with various tools for dependency management, including Python virtual environments, renv, and containerization, and their respective strengths and weaknesses. Ability to create and run simple Docker images.
5.6 Assembling a Full Analysis Pipeline
Learn key factors in organizing an analysis pipeline and develop the skills to assemble a complete, reusable pipeline template.
Learning Objectives:
- Considerations when organizing an analysis pipeline, and the ability to assemble a full template pipeline.
6.1 Key Concepts in Data Integration
This lesson provides an introduction to meta-analysis as a tool for quantitative data integration and research synthesis. Data integration arises when either raw data or summary statistics are available for many subpopulations, for the same or a similar set of outcomes and predictors. In this setting, the goal is to understand the common and distinct ways that the predictors and outcomes are distributed and are related to each other across the subpopulations. Research synthesis arises when results from a collection of research studies considering similar or identical research questions are available. The studies may differ in the populations assessed, in the study designs, or in the methods used. Combining evidence across diverse studies can yield a more accurate consensus estimate of the relationships of interest and can reveal whether there is heterogeneity among the subpopulations in how these relationships are structured.
This document focuses on design, analysis, and interpretation. It includes no code or numerical results. This Python notebook provides some model analyses from which you can borrow ideas as you start to implement analyses informed by the principles covered here.
Learning Objectives:
- Identify settings where data integration is possible and likely to be informative.
- Explain the principle of inverse variance weighting and why it is more effective than simple averaging.
- Explain the difference between uncertainty and estimation imprecision in individual studies or subpopulation-specific results, and contrast this type of variation with the idea of heterogeneity in the true values of a parameter in different studies or subpopulations.
- Explain and contrast error control via the false positive rate, the family-wise error rate, and the false discovery rate, and explain the key ideas behind the local false discovery rate approach.
- Explain the basic mathematics behind methods for pooling estimates, pooling standard errors, and combining p-values from independent sources, and identify methods for combining p-values that are robust to some forms of dependence.
6.2 Assessing Heterogeneity
Heterogeneity in statistics is mainly used to refer to situations where the structural relationships among measured or latent quantities vary across the subpopulations being assessed. This is not variation in the observations themselves, which vary according to a probability distribution determined by measurement errors and intrinsic variation. Instead, it refers to a deeper level of variation that is governed by all of the underlying factors, often unknown, that characterize the different subpopulations.
In this section, we will discuss ways to define heterogeneity in different settings, and how to estimate it from data. The major challenge will be to distinguish the variation of the two types discussed above – the inter-individual variation driven by measurement error and individual differences, and the heterogeneity driven by structural subpopulation differences.
Learning Objectives:
- Identify opportunities to apply visualization methods from applied statistics to the settings of meta-analysis and data integration.
- Articulate the difference between statistical uncertainty and effect heterogeneity.
- Explain the basis and purpose for the intraclass correlation coefficient, and contrast it with τ², the variance of true parameter values across subpopulations.
- Explain how the law of total variation partitions total variation into the explained and unexplained fractions of variability.
- Identify at least one setting where pooling by weighted averaging is inappropriate, and explain a more appropriate way to pool evidence in this setting.
6.3 Modern and Robust Approaches to Evidence Combination
This section discusses more modern and advanced methods for data integration. These approaches are more conceptually advanced than the methods discussed earlier, but may yield deeper results, especially in more challenging settings.
Learning Objectives:
- Articulate the purpose and main idea behind the jackknife empirical likelihood approach in a data integration setting.
- Explain and contrast the definitions of p-values and E-values, and identify some advantages and effective uses for each.
- Explain the rationale for partitioning variance using estimated variance components in a meta-analysis setting, and explain the meanings of explained variation, random main effects, and idiosyncratic variation.
This unit prepares participants to use large language model (LLM) based AI agents as rigorous, accountable tools in biomedical data science research. The unit is load-bearing: its deliverables are components of the 2026 Data Challenge final report. Students work with the same NCHS vital statistics database used throughout the bootcamp, using an LLM ensemble to assist with data navigation, methodological decision-making, grant review, and manuscript preparation, while maintaining human accountability for every output.
Three principles organize the unit. First, invalidation (a framework broader than “hallucination” that encompasses factual, logical, normative, and structural breaches) is mathematically inevitable in any LLM-generated output; human verification is therefore not optional. Second, cross-agent critique reduces invalidation rates below what any single model achieves, but introduces its own ethical tradeoffs that must be actively managed. Third, any sociodemographic variable whose encoding has changed across the historical record carries risks of structural and normative invalidation when queried without contextual grounding.
7.1 The Ethics of AI Agents
This lesson examines the ethical dimensions of using LLM-based AI agents in biomedical data science. Unlike single-turn chatbot interactions, agentic workflows involve planning, tool use, persistent memory, and multi-agent coordination, substantially expanding the ethical surface area of AI-assisted research. Students develop a framework for identifying and classifying invalidation risks, analyze the specific ethical challenges posed by historical vital statistics data with inconsistently encoded racial and ethnic categories, and produce a Research AI Governance Protocol that governs their own use of LLM tools throughout Sections 7.2 and 7.3.
The lesson proceeds in four instructional blocks:
1. Agent architecture and expanded ethical surface (15 min). What distinguishes an AI agent from a chatbot: planning, tool use, memory, and multi-agent coordination. Each capability adds a distinct ethical surface. The discursive network framework explains why agent-generated statements that enter manuscripts acquire authority independent of their accuracy, making verification a structural responsibility rather than an optional quality check.
2. Invalidation: a taxonomy broader than hallucination (15 min). The four types of invalidation (factual, logical, normative, and structural) are introduced using NCHS-specific examples. Factual: an LLM names a variable not present in the DVS schema as a named field. Logical: an LLM recommends a rate denominator inconsistent with the research question’s population definition. Normative: an LLM interprets racial disparities in birthweight as reflecting biological differences between racial groups rather than the consequences of racism. Structural: an LLM queries APGAR score columns for records before 1977, when those columns did not exist in the flat file. Each type requires a distinct verification strategy.
3. Sociodemographic consciousness in biomedical data science (15 min). We explore how many sociodemographic variables are social construct with no valid biological basis, but their reification in law, medicine, and data systems makes it real in its consequences. Birth outcomes differ by recorded race not because of intrinsic racial biology but because of racism: differential access to prenatal care, chronic stress from discrimination, environmental exposures in historically redlined neighborhoods, and differential clinical treatment.
The specific NCHS data students are working with encodes race through a system that changed across the study period. From 1969 through 1977, race was assigned from a fixed set (White, Black, American Indian, Chinese, Japanese, Other), and for parents of different recorded races the child’s race followed the mother’s. Assignment rules were revised in 1978, inconsistently across states. The “Hispanic” ethnic category appeared late in the period and was collapsed into “White” in some years. The child_race_recode_3 field changed its encoding midway through the study period. Any LLM query about race in this dataset risks producing normative invalidation by treating these categories as stable, comparable, and biologically grounded across the full 1969–1986 span.
4. Ethics checklist and governance protocol construction (20 min). The seven risk categories from the ethics framework (epistemic, accountability and authorship, provenance and reproducibility, confidentiality, bias and fairness, security, and sustainability) are reviewed with emphasis on the tradeoffs specific to this bootcamp context. Multi-agent critique tradeoffs: privacy amplification, epistemic homogenization, compute burden, and attribution diffusion. Students construct the Research AI Governance Protocol that governs their subsequent work.
Learning Objectives:
- Define an AI agent in terms of planning, tool use, memory, and multi-agent interaction, and explain how each capability expands the ethical surface area relative to single-turn LLM use.
- Apply the four-type invalidation taxonomy (factual, logical, normative, and structural) to concrete scenarios involving the NCHS vital statistics database, and identify the appropriate verification strategy for each type.
- Articulate why sociodemographic variables historical US vital statistics data often reflect social constructs whose reification has real health consequences, and explain the specific coding inconsistencies in the NCHS 1969–1986 dataset that make naive racial comparisons normatively invalid.
- Construct a Research AI Governance Protocol specifying provenance logging, invalidation classification, sociodemographic variable handling, escalation thresholds, and a compliant disclosure statement for the team’s subsequent AI-assisted work.
7.2 AI Agents for Technical Tasks
This lesson teaches students to use an LLM ensemble as a rigorous technical collaborator on analytical tasks grounded in the NCHS vital statistics database. The session has four sequential blocks. Block A derives the mathematical basis for multi-agent consensus and produces the agent-count commitments that govern subsequent activities. Blocks B, C, and D form an analytical chain: outputs from each block feed the next, and their collective products are load-bearing components of the final data challenge report.
Students enter this session with a completed model report from Unit 4, which documents a predictive model for the data challenge outcome (underweight birth rate or infant mortality rate by Texas county) including the feature selection memo, model comparison table, residual diagnostics, and limitations section. This report is the primary document the LLM ensemble will be asked to interrogate. The governance protocol from Section 7.1 is active from the start of this session; every ensemble interaction concerning the Unit 4 model is logged in the invalidation log.
The governing framework is the Flaws-of-Others (FOO) algorithm, in which multiple agents independently produce outputs, each critiques the others’ responses, and a harmonizer synthesizes the critiques into a refined result. The minimum number of mutually detecting agents required to reduce the long-run false-statement share below a tolerance ε is:
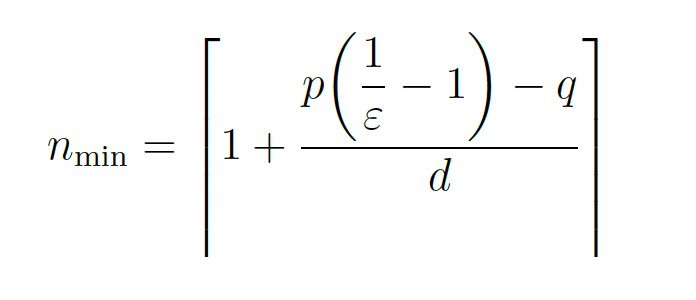
where p is the per-agent invalidation rate, q is the internal self-repair rate (q = 0.05 reference value), and d is the cross-detection probability (d = 0.19 reference value). Students use this formula to make defensible, quantitative decisions about ensemble size for each activity.
Block A — FOO Framework: Derivation and Calibration (20 minutes instructional)
The derivation proceeds from first principles. A single agent has an effective invalidation rate p (combining intrinsic corruption and fabrication). Internal self-repair operates at rate q. Each additional cross-checking agent adds detection hazard d to the effective correction rate. The steady-state false-statement share with n mutually detecting agents is:
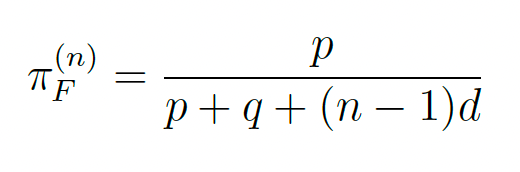
Setting πF(n) ≤ ε and solving for n yields Eq. (7.1). The invalidation floor (proved formally in the underlying theory) establishes that some error rate is mathematically inevitable in any finite-loss LLM; the FOO architecture is the engineering response to this impossibility result.
Students compute nmin for three task categories they will encounter in this session using the reference values above:
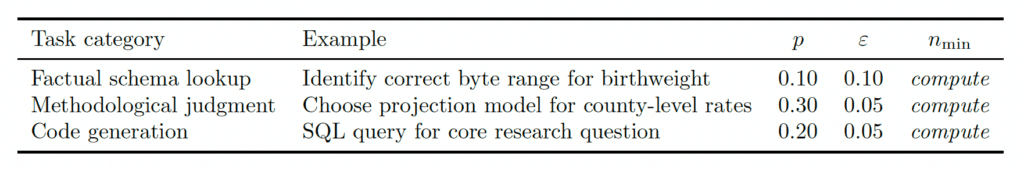
The computed values are entered into the governance protocol as the team’s agent-count commitments for Blocks B, C, and D.
Block B — The Texas Births Problem (35 minutes)
Before the bootcamp, participants were asked to count live births in Texas in 1969 to mothers residing in Texas. Teams compare their answers. Historically, different correct implementations of this query return different counts. The task is to diagnose the source of disagreement using the LLM ensemble.
Teams query the ensemble with the NCHS data dictionary and ask it to: (a) identify every field relevant to the filter, (b) flag any ambiguities in the dictionary language, and (c) write a query implementing the most defensible interpretation. Teams execute the generated query and compare counts across the class.
The deliverable is annotated, executable code (Python or SQL) that implements the correct filter with comments explaining each disambiguation decision. This code is a candidate component of the reproducible pipeline developed in Unit 5.
Model report critique (15 min). Each team submits their Unit 4 model report to the ensemble and prompts it to identify any claim in the methods section that is (a) not reproducible from the written description alone, (b) in tension with a stated limitation, or (c) likely to require verification against the NCHS data dictionary. Teams record each flagged claim in the invalidation log with an invalidation type classification from Section 7.1. For each factual or structural invalidation identified, teams verify the ensemble’s critique against the Unit 4 model code before accepting or rejecting it. Teams that find no invalidations in their Unit 4 report should examine whether the ensemble is producing false-negative outputs (a structural invalidation of the ensemble itself) and document their reasoning.
Block C — Sociodemographic Variable Integrity: Instructor-Led Exploration (15 minutes)
Building directly on Section 7.1, the instructor demonstrates how LLM behavior differs across three sociodemographic variables whose encoding changed across the NCHS study period. For each variable the instructor submits a common query to the ensemble, first without contextual grounding and then with the relevant coding history injected, and the class observes the difference in output.
The three demonstrations pursue the same comparative question: does the ensemble recognize that the variable is historically unstable, and does it flag its own normative or structural claims without prompting? Race is the variable most likely to surface normative invalidation; maternal education is most likely to surface structural invalidation arising from changes in coding categories; geographic identifiers are most likely to surface factual invalidation arising from county boundary or code revisions. Together they illustrate that the retrieval-augmented mitigation strategy from Section 7.1 generalizes to any variable with a documented encoding history.
Students take notes and update the sociodemographic variable handling clause in their governance protocol based on what they observe. The take-home deliverable (Assessment Item 5) asks them to apply the same comparative analysis independently to their own data challenge variables.
Block D — Methodological Decision Support (60 minutes)
Teams use the ensemble to interrogate the model family choice documented in their Unit 4 report. The core prompt pattern is: present the ensemble with the Unit 4 feature set, the outcome distribution description, and the model comparison table, then ask it to (a) identify which alternative model from the comparison was most appropriate given the stated distributional properties of the outcome, and (b) identify any model family that was not evaluated in the Unit 4 comparison but would be worth considering given the data structure. Teams apply Eq. (7.1) to determine the appropriate ensemble size for this task. Every ensemble recommendation is logged and verified against the Unit 4 model diagnostics before being accepted. If the ensemble recommends a model family that the student already evaluated and rejected in Unit 4, teams document whether the ensemble’s reasoning accounts for the diagnostic evidence that motivated the rejection.
Learning Objectives:
- Derive the FOO minimum-agent formula from the steady-state false-share equation and compute nmin for tasks of varying epistemic difficulty, applying the result to make quantitative ensemble-size decisions.
- Use an LLM ensemble to navigate an ambiguous biomedical data dictionary, verify outputs against the authoritative database schema, and produce annotated executable code that implements a defensible query with all disambiguations documented.
- Recognize temporal instability and normative invalidation risk across sociodemographic variables in the NCHS dataset, using sociodemographic variables and apply retrieval-augmented mitigation strategies consistently across all three.
- Produce a structured methodological consensus memo evaluating competing projection approaches, with FOO-calibrated confidence levels, a synthesis recommendation, and a retrospective comparison to the analytic plan developed in Unit 3.
7.3 AI Agents for Grant Review and Manuscript Preparation
This session transfers the technical skills developed in Section 7.2 to the most career-relevant applications of LLM-assisted research: grant review and manuscript preparation. Students work with canonical NIH grant proposals that include their actual panel summary statements, providing ground-truth verification for ensemble outputs. Students also prepare a Specific Aims page for a research proposal using Jackson Heart Study (JHS) data, applying the framework from Section 7.1 to the framing of health disparity research.
The governance protocol from Section 7.1 remains active. The special confidentiality concern of Section 7.3A is emphasized: federal agencies prohibit uploading unpublished proposal text to unapproved AI systems for grant review purposes. The proposals used here are canonical public examples; students are explicitly warned that this constraint applies to any future peer review panel work. The invalidation log from Section 7.2 is updated throughout.
Block A — NIH Grant Review with Ground-Truth Comparison (60 minutes)
Each team selects one canonical NIH grant proposal from the provided collection. These proposals are publicly available examples accompanied by their actual summary statements from review panels.
Prompt design (10 min). Teams design separate prompts for each of the five NIH review criteria: Significance, Investigator(s), Innovation, Approach, and Environment. Each criterion requires different domain reasoning; a single prompt for all five produces superficial output. Teams apply Eq. (7.1) per criterion, recognizing that Approach typically warrants a higher agent count than Environment.
Ensemble review (25 min). Teams run the consensus pipeline across all five criteria. The governance protocol is active; every ensemble interaction is logged.
Comparison analysis (20 min). Teams compare the ensemble’s consensus review to the actual panel summary statement across all five criteria, recording: consensus score, panel score, strengths identified by each, divergence type (missing context, conservative bias, detected concern missed by panel, domain-norm gap), and agreement level.
Critical synthesis (5 min). Teams identify three empirical categories from their comparison data: what the ensemble reliably detected, what it missed systematically, and what varied case by case. This analysis informs a critical reflection on appropriate LLM use in grant preparation.
Block B — JHS Specific Aims: Ensemble-Assisted Drafting (60 minutes)
The coordinator for JHS activities provides: a specific JHS research question, the relevant JHS variables, and two to three published JHS papers as grounding context.
Prompt construction (10 min). Teams design a structured prompt that injects JHS context as a system prompt. The task framing is explicit: not “write my Specific Aims” but rather “given this JHS research question, this prior work, and these three candidate aims, evaluate which aim structure is most scientifically defensible and propose the structure with highest consensus confidence, flagging any claims about JHS data or methods that require independent verification against the provided literature.”
Ensemble drafting (25 min). Teams run the FOO pipeline with JHS context. Every LLM claim about JHS data, published results, or methods is flagged for verification against the provided papers and logged in the invalidation log.
Human revision and sociodemographic framing review (20 min). Teams revise the LLM draft, correcting all logged invalidations. A mandatory step: teams explicitly evaluate whether the drafted Specific Aims treats sociodemographic factors as social determinants of health operating through identifiable structural pathways rather than as fixed biological or demographic properties of the study population. The review must confirm that the framing aligns with current NIH policy on sociodemographic variables in grant applications. Each revision is documented in the invalidation log.Disclosure statement finalization (5 min). The draft disclosure statement from Section 7.1 is revised to reflect the actual scope and nature of AI assistance across all three sections. Teams select the appropriate disclosure level (minimal, standard, or detailed) and produce a finalized statement suitable for inclusion in a peer-reviewed publication.
Learning Objectives:
- Design criterion-specific prompts for LLM-assisted NIH grant evaluation; compare ensemble outputs to actual expert panel judgments; and characterize empirical patterns of agreement, divergence, and systematic miss.
- Construct an ensemble-assisted Specific Aims draft for a JHS research proposal, verifying all LLM claims against published JHS literature and ensuring that sociodemographic factors are framed as social determinants of health operating through structural pathways rather than as fixed biological or demographic properties.
- Produce a finalized disclosure statement appropriate for inclusion in a peer-reviewed publication, accurately reflecting the scope of AI assistance and maintaining full human accountability for all outputs.
8.1 Introduction to the Jackson Heart Study
This lesson provides an overview of the Jackson Heart Study (JHS), focusing on its design, data collection, and variable interpretation. Students will describe the JHS’s purpose, population, and exam structure, summarize clinical, survey, and genetic data collection methods across study phases, and learn to use JHS codebooks to identify variables for research questions.
Learning Objectives:
- Describe the JHS Study Design: Explain the purpose, population, and structure of the JHS, including its major exams.
- Summarize Data Collection Methods: Identify the types of data collected (e.g., clinical, survey, genetic) and the methods used in different study phases.
- Interpret Key Variables and Codebooks: Understand how to use JHS codebooks to find variables relevant to specific research questions.
8.2 The Process of Manuscript Development in the Jackson Heart Study
This lesson covers the process for requesting and obtaining JHS data. Students will learn to navigate data access procedures, including submitting manuscript or ancillary study proposals, completing data use agreements, and addressing ethical considerations to ensure responsible use of JHS data.
Learning Objectives:
- Explain Data Access Procedures: Describe the process for requesting and obtaining JHS data, including data use agreements and ethical considerations.
Upcoming Bootcamps
Develop the intellectual framework and technical skills to ensure the rigor and reproducibility of biomedical and healthcare research with cutting-edge data science and artificial intelligence (AI) methods.
Open to university faculty and research scientists.
Participation in the training program is free of charge. Scholarships are available.
Questions
For additional questions, please email our DAIR3 program team at [email protected].