Alfred O. Hero, PhD, is the R. Jamison and Betty Williams Professor of Engineering at the University of Michigan and co-Director of the Michigan Institute for Data Science.
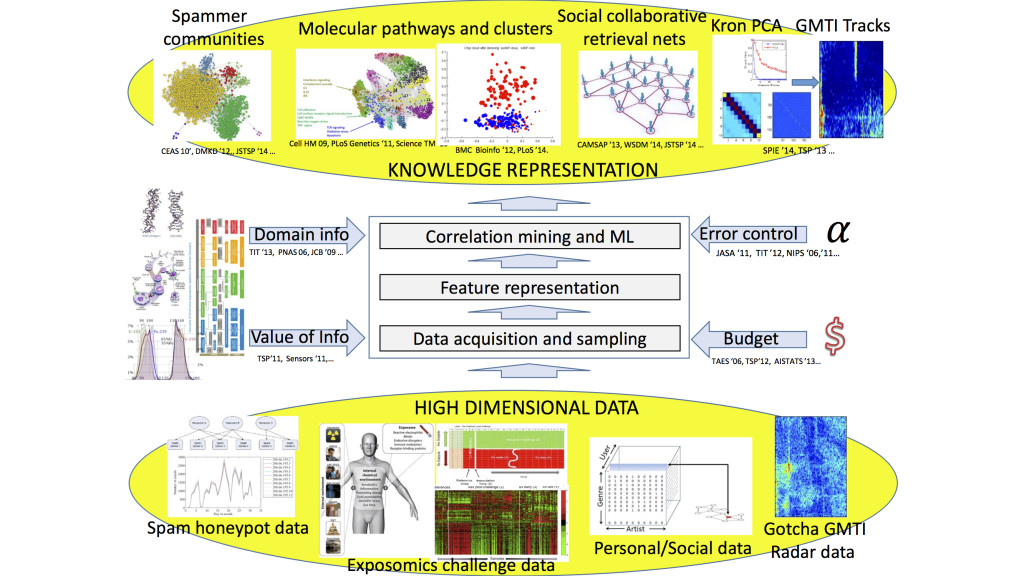
The Hero group focuses on building foundational theory and methodology for data science and engineering. Data science is the methodological underpinning for data collection, data management, data analysis, and data visualization. Lying at the intersection of mathematics, statistics, computer science, information science, and engineering, data science has a wide range of application in areas including: public health and personalized medicine, brain sciences, environmental and earth sciences, astronomy, materials science, genomics and proteomics, computational social science, business analytics, computational finance, information forensics, and national defense. The Hero group is developing theory and algorithms for data collection, analysis and visualization that use statistical machine learning and distributed optimization. These are being to applied to network data analysis, personalized health, multi-modality information fusion, data-driven physical simulation, materials science, dynamic social media, and database indexing and retrieval. Several thrusts are being pursued:
- Development of tools to extract useful information from high dimensional datasets with many variables and few samples (large p small n). A major focus here is on the mathematics of “big data” that can establish fundamental limits; aiding data analysts to “right size” their sample for reliable extraction of information. Areas of interest include: correlation mining in high dimension, i.e., inference of correlations between the behaviors of multiple agents from limited statistical samples, and dimensionality reduction, i.e., finding low dimensional projections of the data that preserve information in the data that is relevant to the analyst.
- Data representation, analysis and fusion on non-linear non-euclidean structures. Examples of such data include: data that comes in the form of a probability distribution or histogram (lies on a hypersphere with the Hellinger metric); data that are defined on graphs or networks (combinatorial non-commutative structures); data on spheres with point symmetry group structure, e.g., quaternion representations of orientation or pose.
- Resource constrained information-driven adaptive data collection. We are interested in sequential data collection strategies that utilize feedback to successively select among a number of available data sources in such a way to minimize energy, maximize information gains, or minimize delay to decision. A principal objective has been to develop good proxies for the reward or risk associated with collecting data for a particular task (detection, estimation, classification, tracking). We are developing strategies for model-free empirical estimation of surrogate measures including Fisher information, R'{e}nyi entropy, mutual information, and Kullback-Liebler divergence. In addition we are quantifying the loss of plan-ahead sensing performance due to use of such proxies.

