Author: Allie Cell, College of Engineering
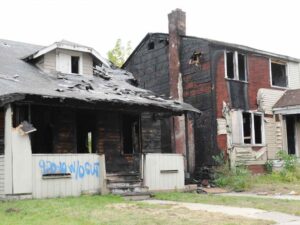
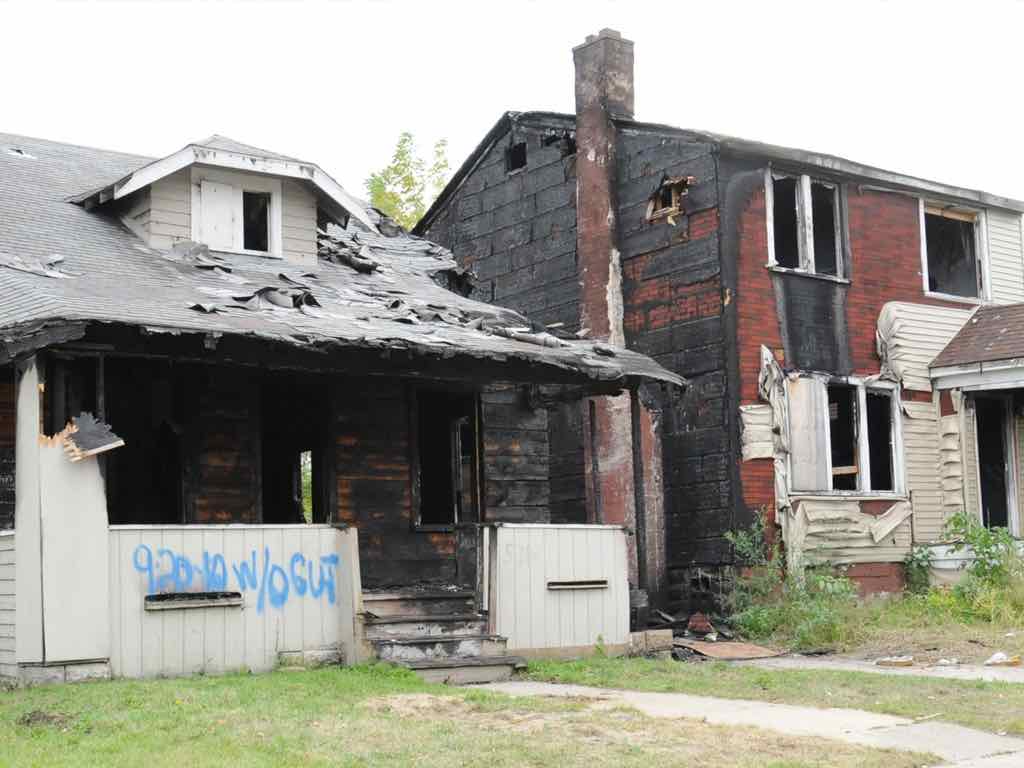
Property blight, which refers to lots and structures not being properly maintained (as pictured above), is a major problem in Detroit: over 20% of lots in the city are blighted. As a measure to help curb this behavior, in 2005 the City of Detroit began issuing blight tickets to the owners of afflicted properties, which include fees ranging from $20, for offenses including leaving out a trash bin too far before its collection date, to $10,000, for offenses including dumping more than 5 cubic feet of waste. Unfortunately, however, only 7% of people issued tickets and found guilty actually pay the ticket, leaving a balance of some $73 million in unpaid blight tickets.
Officials from the City of Detroit’s Department of Administrative Hearings and Department of Innovation and Technology who work with blight tickets and the Michigan Data Science Team initially came together this past February to sponsor a competition to forecast blight compliance. To provide a more actionable analysis for Detroit policymakers, we aimed to understand what sorts of people receive blight tickets, how we can use this knowledge to better grasp why blight tickets have not been effective, and to provide insights for policy makers accordingly.
THE DATA
In order to get an accurate picture of blight compliance in Detroit, we aggregated information from multiple datasets. The Detroit Open Data Portal is an online center for public data featuring datasets including those related to public health, education, transportation; that is where we obtained most of our datasets from. Some of the most valuable datasets we used included:
Blight Ticket Data, records of each blight ticket
Parcel Data, records of all properties in Detroit
Crime Data, records of all crimes in Detroit from 2009 through 2016
Demolition Data, records of each completed and scheduled demolition in Detroit
Improve Detroit, records of all issues submitted through an app whose goal is improving the city
PREDICTING BLIGHT TICKET COMPLIANCE
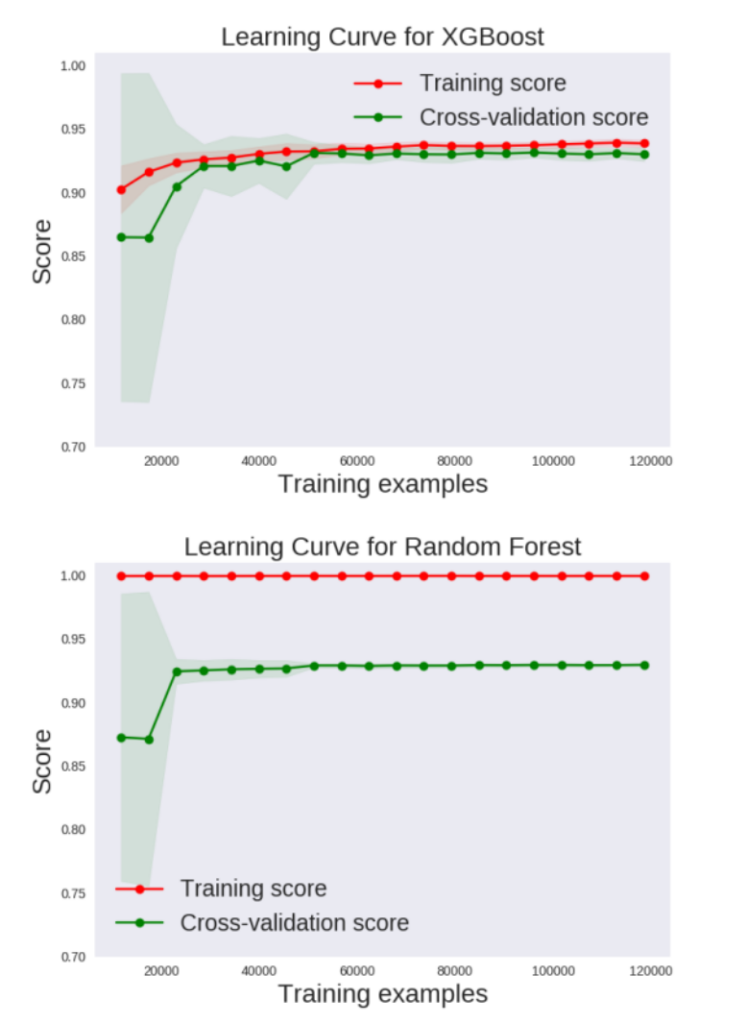
We built a model to predict whether a property owner would pay their blight ticket. Each record in the dataset had one-hot encoded data from the sources listed above. It has been observed that tree methods are easily interpretable and perform well for mixed data, so we considered scikit-learn Random Forests and the xgboost Gradient Boosted Trees (XGBoostClassifier). To choose the best model, we generated learning curves with 5-fold cross-validation for each classifier; xgboost performed well with a cross-validation score of over .9, so we selected this model.
ANALYSIS OF TICKETED PROPERTY OWNERS
To gain a more holistic understanding of the relationships between ticketed property owners and their properties, we analyzed three categories of property owners:
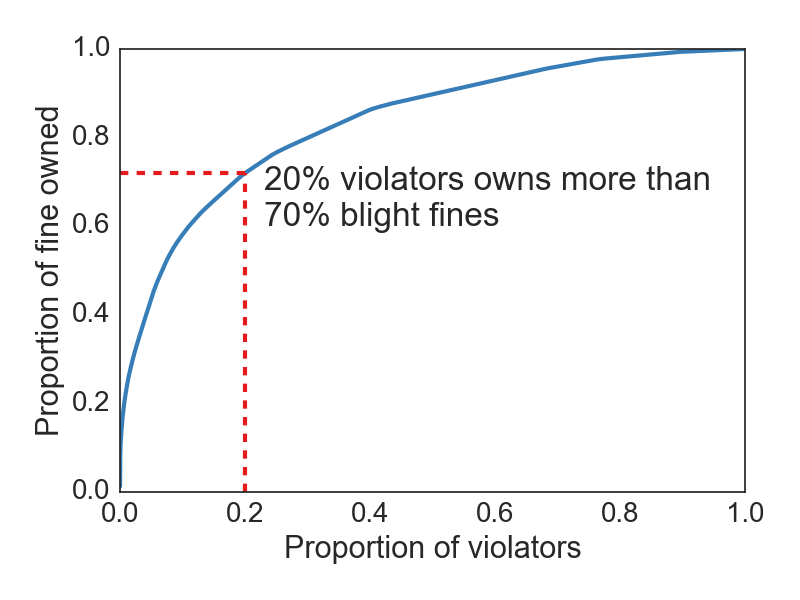
Top Offenders, the small portion of offenders who own many blighted properties and account for the majority of tickets–as shown above, 20% of violators own over 70% of unpaid blight fines
Live-In Owners, offenders who were determined to actually live in their blighted property, indicative of a stronger relationship between the owner and the house
Residential Rental Property Owners, offenders who own residential properties but were determined to not live in them, indicative of a more income-driven relationship between the owner and the property
After deciding to focus on comparing these three groups, we found some notable differences between each owner category:
Repeat Offenses: only 11% of live-in owners were issued more than two blight tickets (71% of live-in owners received only one blight ticket); the multiple offense rate jumps to 20% when looking at residential rental property owners (59% of residential rental property owners received only one blight ticket).
Property Conditions: only 4.8% of the ticketed properties owned by live-in owners were in poor condition, compared to 7.1% for those owned by residential rental property owners and 8.8% for those owned by top offenders
Compliance: only 6.5% of tickets issued to top offenders were paid (either on time or by less than 1 month late), which is significantly less than the 10% and 11% rates for residential rental property owners and live-in owners respectively
Occupancy Rates: live-in owners saw the highest occupancy rate on properties that were issued blight tickets, 69%, followed by 57% for residential rental property owners and 47% for top offenders. While this trend makes sense, we would really expect a 100% occupancy rate to focus on properties that owners are actively living in, and thus the distance from 100% is one testament to a problem our team faced in data quality–both from inconsistency in records and from real estate turnover in Detroit.
Feel free to check out the whole paper ~ here ~


