Authors: Weifeng Hu and Divyansh Saini
The Competition
We represented the Michigan Data Science Team (MDST) in the Midwest Undergraduate Data Analytics Competition hosted by MinneAnalytics in Minnesota.
We were provided insurance claims data for people diagnosed with Type-II diabetes. At the novice level, the goal was to use this data to find meaningful patterns in age group, gender and geolocation for patients with Type II Diabetes. This information would then be further used to generate cost-saving mechanisms.
Experience
The first step to work on this challenge was to understand the dataset. We had medical claims for patients who have Type II Diabetes from health care facilities, pharmacies and laboratories. The files in the dataset are described below following:
medical_training.csv: claims when patients visited a hospital and related data
confinement_training.csv: claims for when patients were confined to the hospital
rx_training.csv: pharmacies claims of drugs prescribed to the patients
labresult_training.csv: claims for laboratory experiments
member_info.csv: file contains information about gender, age, location of patients
Through our meetings with MDST members, we realized that most teams would be approaching this problem with the purpose of predicting the diagnosis or finding patterns in the comorbidity.
To stand out, we decided to focus on finding the sub-populations who have the highest cost after day 0 being of diagnosed with type-II diabetes.
Methodology
We performed K-means clustering on claims in medical_training.csv to find generalized patterns among different groups.
– Data Preprocessing:
The entries in medical_training.csv contain medical claims for each hospital visit for a patient. A patient will have multiple entries if he/she visited the hospital more than once. In each entry, there were at most five ICDM-9* diagnosis codes for each visit. It contains five characters that are mostly numbers, e.g. “12345”. This code can be grouped into 19 categories of diseases and each category contains a range of codes.
The first preprocess step we performed was to “shrink” the number of rows. We used patients ID to group each diagnosis to each patient. After that we constructed a 0/1 indicator feature vectors of length 19. Each column represented a type of disease and the value on that column would 1 if the patient was diagnosed with that disease. Each row in the feature vector contains the information of a particular patient’s diagnosis.
– Hyperparameter Tuning
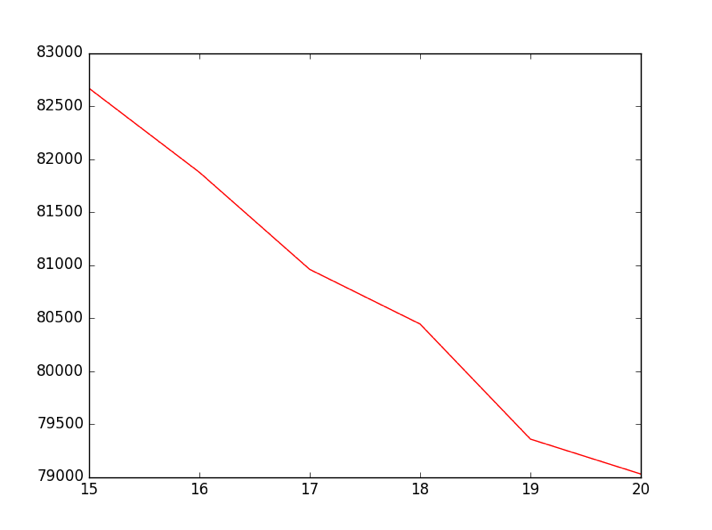
After making the data into feature vectors, we can know perform k-means clustering. . k-means clustering is partitioning observations into a finite number(k) of clusters or groups in which each observation belongs to a cluster with the nearest mean. However, we still need to decide the number of clusters k. We want to find the number of clusters that result in small intracluster distance but do not overfit the data. To do this we used the “elbow heuristic”, which states that if on plotting the cost of k-means(the sum of the intracluster distance) with respect to k, we should choose a k value that has a significant drop before the that point and no significant drop after that point. As in the graph above, where the x-axis is the value of k and the y-axis is the cost of [1]k-means clustering, we can see that k=19 is a good choice.
Result
From the data analysis we performed, we realized that the average cost of each visit for a patient remained the same regardless of when the hospital visit occurred, but the amounts of visits increased significantly after the day that they were diagnosed. This resulted in a significant increase in the total cost, as can be seen in the graph below.
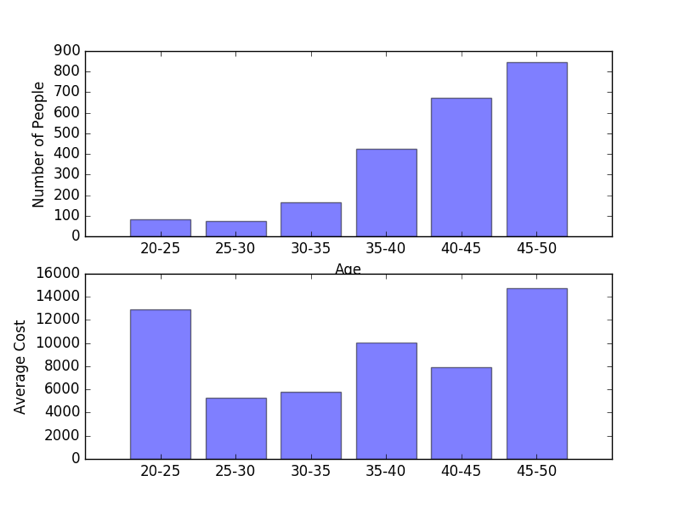
Another interesting finding was that although the number of patients diagnosed with Diabetes-II increased with age, the average cost was highest for ages 20-25 and 45-50, as shown in the graph below. This trend was common among different clusters. From this data, we were able to conclude that the people who were diagnosed in those two age groups had similar diseases. This suggests that we should focus on the age group who are diagnosed with diabetes at this younger ages will have a significantly higher cumulative costs as they live their life.
What we learned
From this competition, we learned that it was important to style our slides for the presentation. The judges commented us as “one of the most technical solid presentation”. However, we made some mistake on the slides and some axes on the graph are not clearly labeled. As a result, we did not make to the finalis. Nevertheless, it was really encouraging to know that the judges were impressed by our analytical skills.
But beyond that, at the competition itself we were impressed by the various interesting ways that the upper level teams used to predict the highest at-risk patients. One of them used models similar to what credit-card companies use to predict credit ratings for its clients. This was definitely out of the box and I was surprised to see that it actually worked.
And finally, we realized that it is important to persist. We encountered a significant delay before we received the real data(in fact, we did not have it until 5 days before the competition). It was challenging to try to come up with good analysis in that short period of time. However, with the help of our faculty mentor Sean, we were able to find meaningful patterns in the dataset. We wish we can have more time so that we can explore trends in other dataset.


