Authors: Michael Kovalcik, College of Engineering; Xinyu Tan, College of Engineering; Derek Chen, Ross School of Business.
Problem Overview
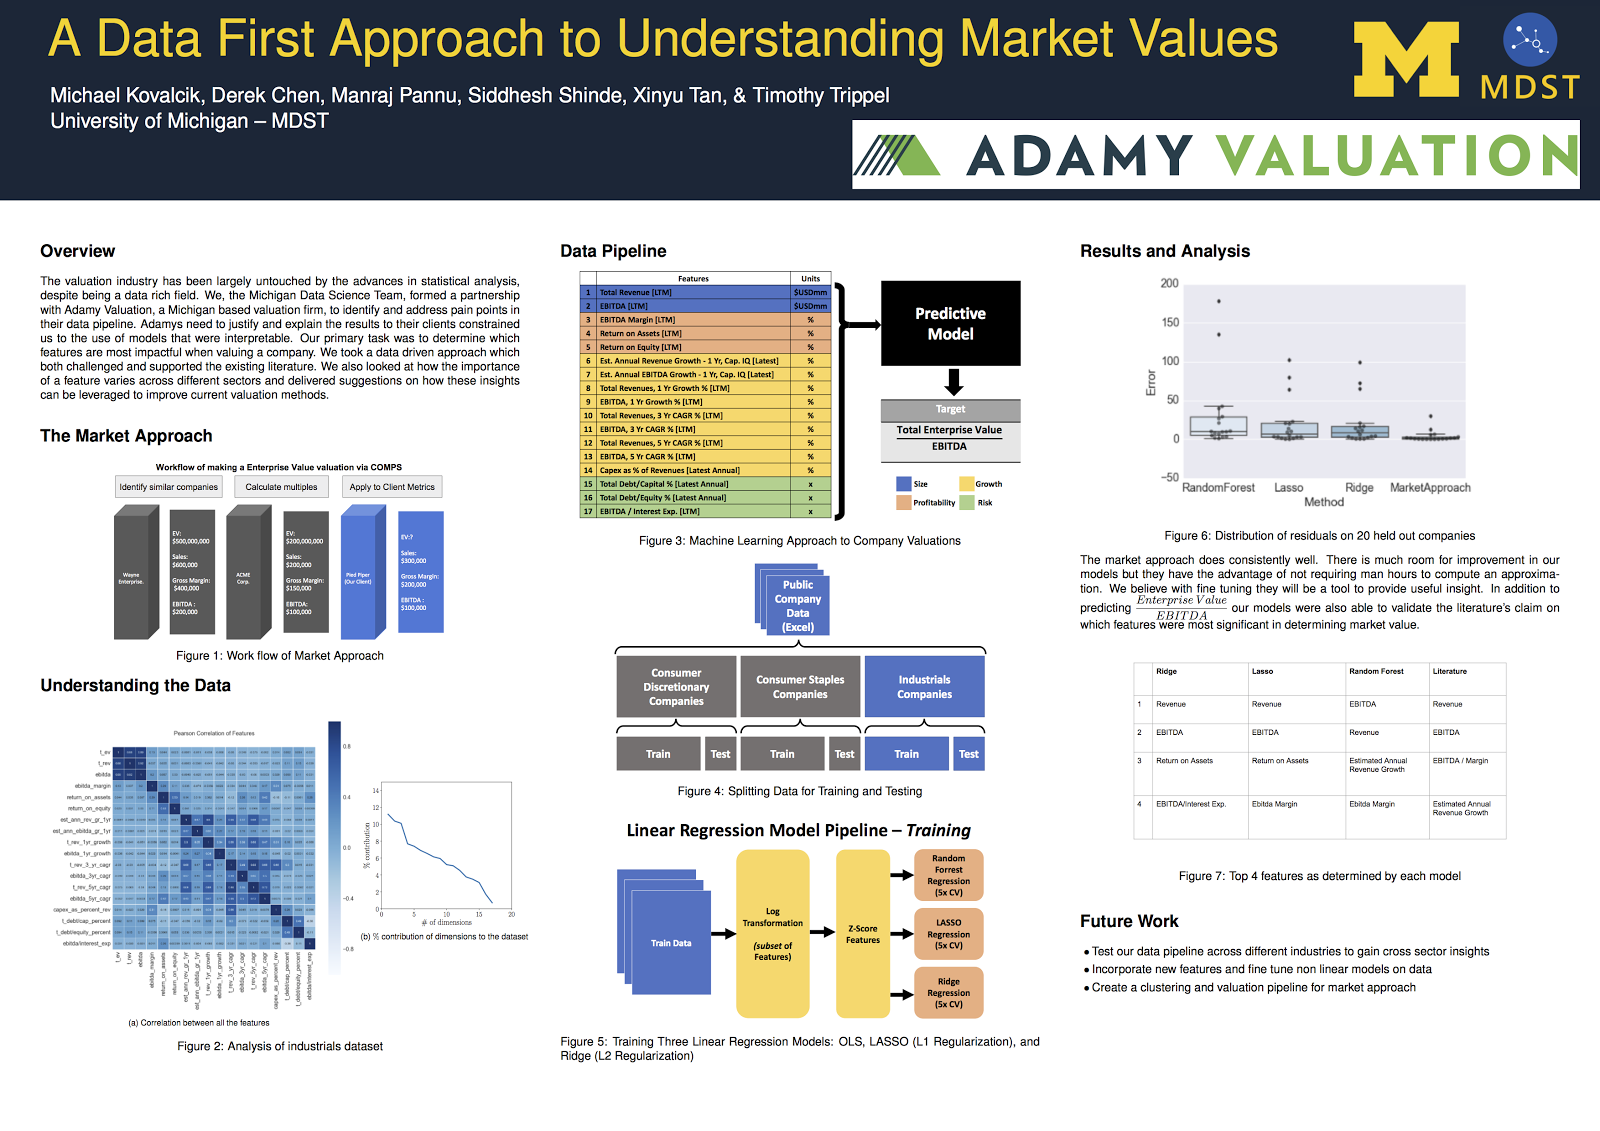
![]() The Michigan Data Science Team partnered with Adamy Valuation, a Grand Rapids-based valuation firm, to bring data-driven insights to business equity valuation. Business valuation firms determine the market value of business interests in support of a variety of different types of transactions typically involving ownership interests in private businesses. Valuation firms, such as Adamy Valuation, deliver this assessment, which includes a detailed report explaining the reasons why they believe it to be fair.
The Michigan Data Science Team partnered with Adamy Valuation, a Grand Rapids-based valuation firm, to bring data-driven insights to business equity valuation. Business valuation firms determine the market value of business interests in support of a variety of different types of transactions typically involving ownership interests in private businesses. Valuation firms, such as Adamy Valuation, deliver this assessment, which includes a detailed report explaining the reasons why they believe it to be fair.
Valuations are performed by expert financial analysts, who use their knowledge about the factors that influence value to manually assess the value of the equity. Shannon Pratt’s Valuing a Business suggests that there are two key factors in particular that influence value: risk and size. Risk is a measure of uncertainty relating to the company’s future and can be assessed by looking at total debt and cash flows. Size refers to a company’s economic power. Larger companies will spend and make more than smaller ones. While these factors are quite informative, the degree to which they influence value varies a lot from industry to industry and even from company to company. Therefore, a valuation firm will often adjust their models manually to account for additional features, using knowledge gained from years of experience and industry expertise.
Our goals were to conduct a data-driven analysis of the valuation process and to build a predictive model that could learn to make value adjustments from historical data. A critical requirement of our approach was that the resulting model must be interpretable. An algorithm that is extremely accurate but offers no insight into how the prediction was made or what features it was based off of is of no use to Adamy Valuation because, at the end of the day, they must be able to validate the reasoning behind their assessment.
 The Data Pipeline

While our goal is to value private companies, data related to these companies is difficult to come by. Business valuation analysts address this issue by using market data from public companies as guideline data points to inform the valuation of a private subject company. To this end, we acquired a dataset of 400 publicly-traded companies along with 20 financial metrics that are commonly used during valuation. We cleaned this dataset to only contain features that are relevant to private companies so that the model learned on public companies could later be applied to value private companies.
We separate financial metrics into four categories: Size, Profitability, Growth, and Risk, as indicated by the colors in Fig. 1. Our goal was to determine which of the four categories, or more specifically, which features in these categories, contribute the most to:
 where TEV represents the Total Enterprise Value a measure of a company’s market value, adjusting for things like debt and cash on hand, and EBITDA stands for earnings before interest, tax, depreciation, and amortization. EBITDA allows analysts to focus on operating performance by minimizing the impact of non-operating decisions such as which tax rates they must pay and the degree to which their goods depreciate. In other words EBITDA gives a clearer value for head to head comparisons of company performance. Valuation firms typically examine the ratio of TEV and EBITDA instead of examining TEV or EBITDA directly, because the ratio standardizes for the size of the company, making it easier to make apples to apples comparisons with companies that may be much larger or smaller, but are otherwise similar.
To study how feature importance varied across industries, we categorized each public company into one of three separate sectors:
- Consumer Discretionary refers to companies that provide goods and services that are considered nonessential to the consumer. For example, Bed Bath and Beyond, Ford Motor Company, and Panera Bread are all part of this category.
- Consumer Staples provide essential products such as food, beverages, and household items. Companies like Campbell’s Soup, Coca Cola, and Kellogg are considered Consumer Staples.
- Industrial Spending sector is a diverse category, which contains companies related to the manufacture and distribution of goods for industrial customers. In this dataset we see companies like Delta Airlines, Fedex, and Lockheed Martin.
Modeling
Our goal is not just to accurately estimate value, but also to identify key relationships between a company’s observable metrics and its ratio of TEV to EBITDA.We study 17 financial metrics, many of which have complex relationships with the ratio of TEV and EBITDA. To identify these relationships, we model the problem as a regression task. We use two simple but widely-used frameworks: linear models and tree-based models because both methods offer insight into how the predictions are actually made.
After fitting our models to the data, we identified the most predictive features of company value across industries, and compared this to profit margin and size, the metrics most commonly used in Valuing a Business. For our linear models we used the coefficients in our regression equation to determine which features were most important. For our random forest model we used the feature importance metric which ranks features according to the information gained during the fitting process.
 Results
The figure to the right depicts the accuracy our models versus the market approach (also known as comparable approach), the method used by valuation firms. With the size of the dataset and the specificity of the market approach we are not surprised that it outperforms our models. Rather we are showing here that our models have a reasonable enough degree of accuracy to trust the interpretation of the features.
 Also on the right we show the top 3 features, according to information gain, per industry as learned by our random forest model. The larger the bar the more insightful that variable was for predictions.The features we see turning up in our model are indicators of profitability and size which agree with the existing knowledge in the literature. It is interesting to note that return on assets shows up in each sector which intuitively means the market values those companies that get high returns regardless of the sector.
Explanation of Key Predictors
Remember our goal was to predict TEV/EBITDA, which is a measure of company’s total value after standardizing for things such as size, tax structure, and number of other factors. There were 5 distinct predictors that really stood out in our analysis.
Return on Assets is a measure of a company’s efficiency in generating profit.
Total Revenue is also known as total sales and is a measurement of how much a company receives from the sale of goods and services.
EBITDA 1 year growth: EBITDA is a measure of profitability and growing EBITDA means growing profit and increasing value of a company.
A Capital Expenditure(Capex) is the amount of money that a company invested in property and equipment. Capex is often linked to the expansion or contraction of a business and is therefore a measure of growth. Looking at Capex as percentage of revenue provides a normalized measurement for comparison.
EBITDA Margin serves as an indicator of a company’s operating profitability. Higher EBITDA margin means the company is getting more EBITDA for every dollar of revenue.
MSSISS
MSSISS or the Michigan Student Symposium for Interdisciplinary Statistical Sciences is an annual conference hosted by the University of Michigan. MSSISS brings together statistics works from a number of different fields including computer science, electrical engineering, statistics, biostatistics, and industrial operations. Our poster was particularly interesting as it was the only one with a financial application. The novelty of our project drew in a number of viewers and impressed the judges. A major component of our poster score was determined by our ability to communicate our results to people outside the field. We received a certificate of merit for our work and ability to communicate it to the other attendees at the conference.